
 Back
BackTidbit: Online Infographic Maker Web App
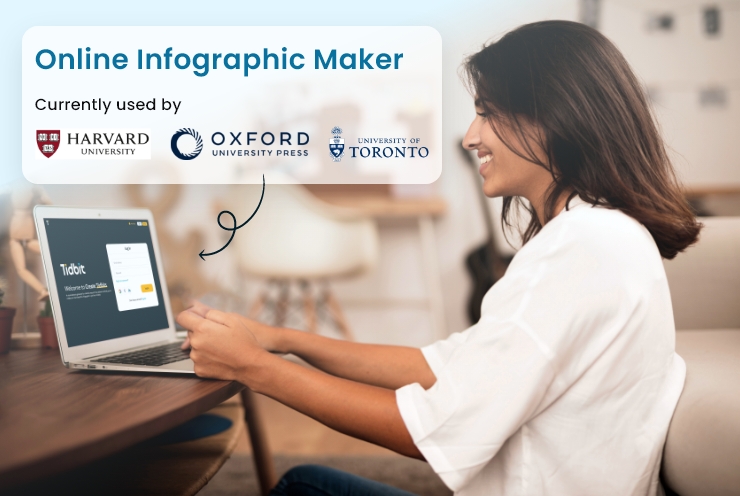
Tidbit is a free infographic maker built for researchers who need to summarize their studies visually. A Canadian computer scientist approached Space-O Technologies after failing to find a suitable tool during his own research. What we built turns a published article or preprint manuscript into a complete graphical abstract in five to ten minutes. The web application also connects scholars directly with publishers on one platform. Oxford, Harvard, UCSF, University of Toronto, Ottawa, and McMaster are among the universities that have used the solution.
5 to 10 Min
To Build a Complete Graphical Abstract
7 Steps
From Research Paper to Finished Infographic
100+
Ready-Made Research Templates
About Tidbit
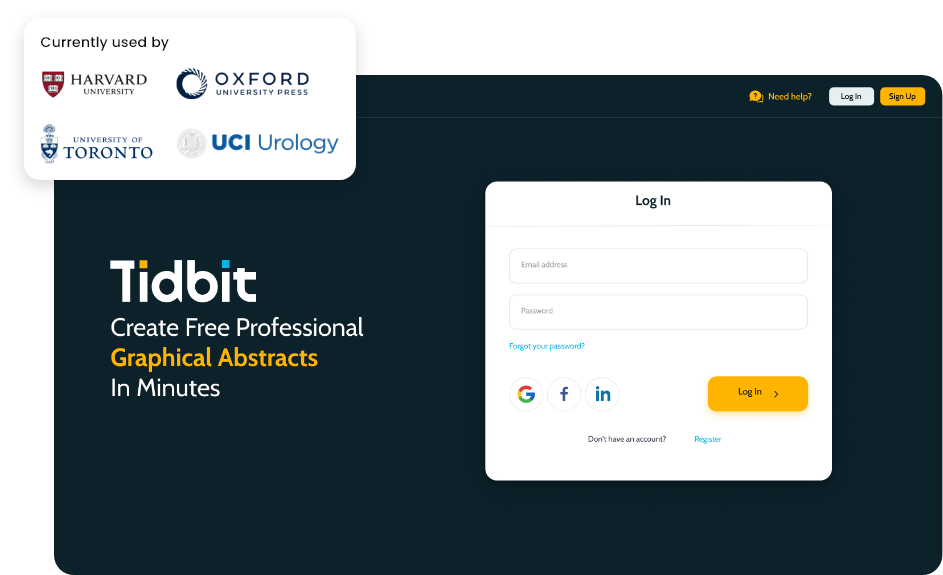
Tidbit is a free, easy-to-use infographic maker that helps researchers build interactive infographics in minutes. Professional templates handle the design work. Researchers spend their time on the content instead. Oxford, Harvard, UCSF, the University of Toronto, and McMaster are among the institutions that have used the platform.
The workflow runs in seven steps from source article to finished graphical representation. Once a visual is complete, researchers submit it directly to leading publishers through the platform. No separate submission process or file handoff is required.
Three subscription plans serve different users. Standard is free, Professional is priced at $9.99 per visual, and Institution pricing is custom. The tiers let individual researchers and full departments work with the same tool.
How We Built the Infographic Maker Web App
Our client is a computer scientist with a deep background in crypto, distributed systems, and design. He found Space-O Technologies through a Google search and set a high bar for the build. His brief covered three things. He wanted a web solution for creating infographics, a single platform linking scholars with publishers, and a template library that speeds up design.
Researcher Dashboard and Project Entry Point
Requirement:
Researchers needed a clear starting point that recognized the two ways academic work arrives, as a published article or as a preprint manuscript.
Solution:
The dashboard opens with that choice. Researchers pick published article or preprint manuscript, then move into the template library. Pre-uploaded templates are available from this first screen. Nothing about the entry flow requires design knowledge or manual setup.
Article Search and Retrieval
Requirement:
Users working from published research needed to locate their own article quickly rather than re-entering study details by hand.
Solution:
Search functionality lets researchers type an article name and pull a matching list. Selecting the correct article from those results starts the build. This shortens the gap between opening the tool and having real research content ready to visualize.
Research Template Library
Requirement:
The client wanted ready-made templates that would speed up infographic design instead of asking researchers to start from a blank canvas.
Solution:
We built a template library organized by study type. Options cover general, randomized, systematic, prospective, retrospective, case-control, and cross-sectional research, among others. Researchers choose the template matching their study design. The visual structure therefore suits the methodology before any content goes in.
Content Editor With Real-Time Preview
Requirement:
The internal editing layout called for the active editing area to stay highlighted while everything else on screen dimmed. The framework offered no default property for this behavior.
Solution:
Our React.js developers researched the problem and wrote custom CSS properties aligned to the framework. They then integrated those properties into the solution. The editor supports adding, updating, editing, and deleting content. Background color options, icon changes, and description edits are all available, and researchers see changes as they make them.
Publisher Portal and Submission Review
Requirement:
The second core requirement was a single platform connecting scholars with publishers, which meant publishers needed their own working environment.
Solution:
Publishers get a dedicated dashboard showing submitted, approved, rejected, and pending infographic requests. They also get editing control over heading color, footer color, and icons on incoming infographics. Approved visuals move to publication from a selection list. Publishers retain full records of everything that has gone live.
Export, Save, and Subscription Management
Requirement:
Finished visuals had to leave the platform in usable form. The product also needed to serve individual researchers and institutions on different commercial terms.
Solution:
Zoom, save, and export controls let researchers inspect a graphical abstract closely and take the finished file with them. Add Elements gives further control over what appears on the canvas. Three subscription tiers sit behind this, running from free Standard access through Professional at $9.99 per visual to custom Institution pricing.
Core Features of Tidbit An Infographic Maker Web App
Dashboard
Start an infographic by choosing between a published article and a preprint manuscript. Pre-uploaded templates are available immediately for building a graphical abstract from your research.
Search Functionality
Locate your published article by typing its name and selecting from the returned list. Selecting the article moves you straight into the build.
Template Selection
Choose from templates covering general, randomized, systematic, prospective, retrospective, case-control, cross-sectional, and other study types. Pick the one that matches your research design.
Content Editor
Add, update, edit, and delete everything you want in the visual. Editing options include multiple background colors, icon changes, and description updates.
Zoom, Save, and Export
Zoom in to check detail on the graphical abstract, save your progress as you work, and export the finished visual for use.
Add Elements
Place additional icons and visual components onto the canvas. This builds out the infographic beyond what the base template provides.
Publisher Dashboard
View submitted, approved, rejected, and pending infographic requests sent by researchers for journal publication. All incoming requests are managed from one screen.
Send for Publishing
Select an infographic from the approved list and make it live. Publishers keep full records of everything published from their end.
What the Platform Delivers
5 to 10 Min
To produce a complete graphical abstract from a published article or preprint manuscript.
7 Steps
A complete research-to-infographic workflow, from source article through to finished visual.
3 Subscription Tiers
From free Standard access through Professional at $9.99 per visual to custom Institution pricing.
Direct Submission
A route straight from researcher to publisher, with no separate submission process or file handoff.
Research and Publishing Workflows the Platform Supports
Academic Researchers Publishing Graphical Abstracts
University Research Departments
Preprint Manuscript Authors
Peer-Reviewed Journal Publishers
Systematic and Randomized Study Reporting
Case-Control and Cross-Sectional Research
Prospective and Retrospective Study Summaries
Institutional Research Communication Teams
Individual Researchers on Pay-Per-View Access
Multi-User Institutional Subscriptions
Scholar to Publisher Submission Pipelines
Technology Stack We Used
Frontend Development
 React.js
Backend Development
 Ruby on Rails
Database
 MySQL
MySQL
What We Delivered
Space-O Technologies built Tidbit from scratch, covering both the researcher-facing product and the publisher environment behind it.
Idea Validation and Requirement Analysis
UI/UX Design for User-End and Internal Interfaces
ReactJS Development (Frontend)
Ruby on Rails Development (Backend)
Custom CSS Component Engineering
Publisher Portal Development
Related Case Studies
Fyule Online Learning Platform
A video-first learning platform where students submit recorded work, join contests, and track progress across schools.

ReadGenie: OpenAI-based Image-to-Text App
ReadGenie is a reading assistant app that extracts text from images using OCR and the GPT 3.5 model.

Field Service Management Solution
A web-based field service platform for scheduling jobs, dispatching technicians, and capturing work completed on site.
Want to Build a Graphic Design Web Solution?
Talk to our developers about your web app idea. We validate the concept, map the build, and get development moving on a clear scope.


 All our projects are secured by NDA




 4.8
4.8